Turn Your Spreadsheet of Addresses Into a Map
Interactive, Embeddable Maps Included with All Spreadsheet Uploads

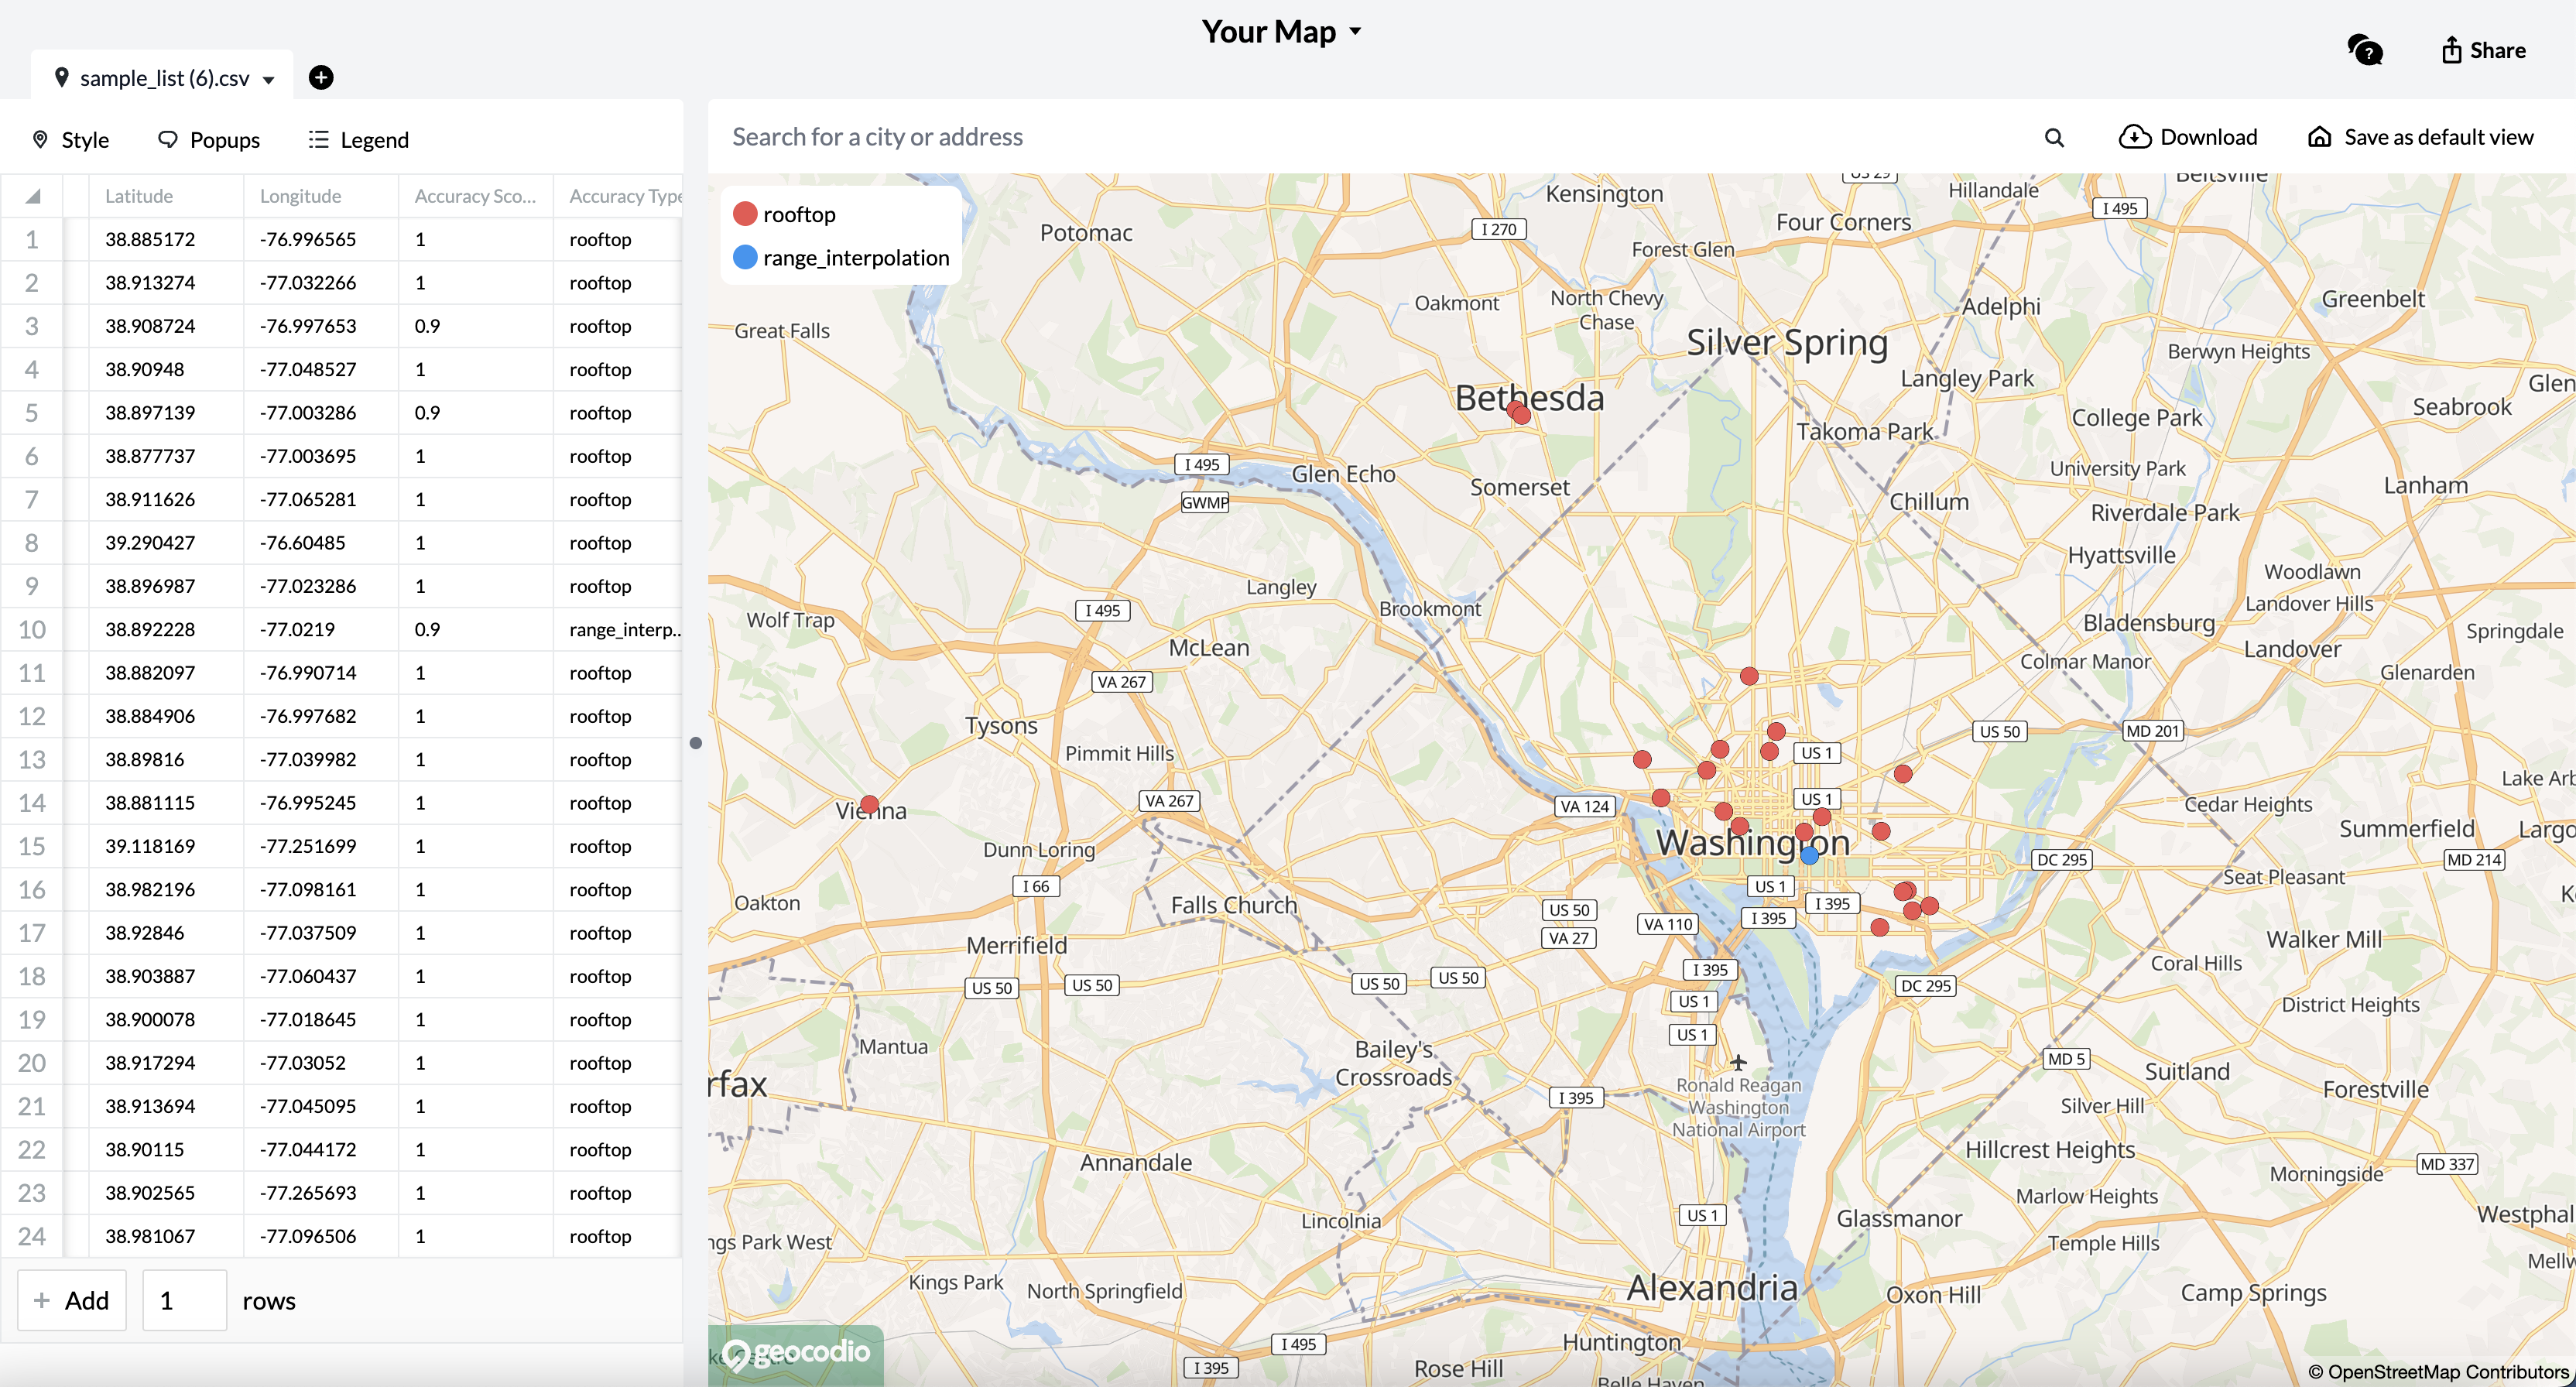
Whenever you upload a spreadsheet of addresses or coordinates to Geocodio, in addition to a downloadable CSV, you'll also have the option to create an interactive map — at no additional charge.
Visualize your data by plotting your geocoded coordinates as customizable markers, add layers to highlight the regions you're working in, and share your map with friends or colleagues to display your results.
Included With Uploads
Spreadsheets you upload can be converted into a map at no additional cost. Plot up to 100,000 rows per map.
Customize Markers
Stylize your markers by selecting from a variety of icons, colors and sizes. Add clickable popups to display address data.
Share and Embed
Easily embed your interactive map into any website or share a read-only link with your colleagues.
Add Boundary Layers
Choose from dozens of built-in layers such as congressional districts, school districts and census-designated areas such as census tracts.
Dynamic Categories
Make your map more dynamic by including categories labels in your spreadsheet. Customize each category individually to create more dynamic visualizations.
Unlimited Page Views
When your maps catch fire, the last thing you should worry about is a big bill. We celebrate success with you by including unlimited map views.