Getting Started
What you can do with GeocodioSpreadsheet formattingAddress completionSpelling CorrectionFile formatsFile sizesIntersectionsPreviewing your spreadsheetReverse geocodingGoogle Maps API CompatibilityData Appends
Data Enrichment OverviewCensus Block/Tract/FIPS/GeoIDUSPS ZIP+4 (Full ZIP9)Congressional Districts & Contact InfoState Legislative DistrictsCensus: DemographicsCensus: Education & Veteran StatusCensus: FamiliesCensus: HousingCensus: IncomeFFIEC DataOCD IDsSchool DistrictsProvincial/Territorial RidingsFederal RidingsCanadian Census GeographiesTimezonesTroubleshooting
Country supportMap preview shows AfricaMissing coordinatesRow estimate too highSYLK ErrorTestingWhy are latitudes/longitudes slightly different when reverse geocoding?What happened to counties in Connecticut?What is a Census Block Group?Missing Leading Zeroes In SpreadsheetCongressional District 00 or 98Access Not Allowed ErrorBilling & Payment
Sales TaxesW-9Pay-As-You-Go CreditsEstimates/QuotesSet a usage limitWhat's a 'lookup'?When will I be charged?Heatmapping
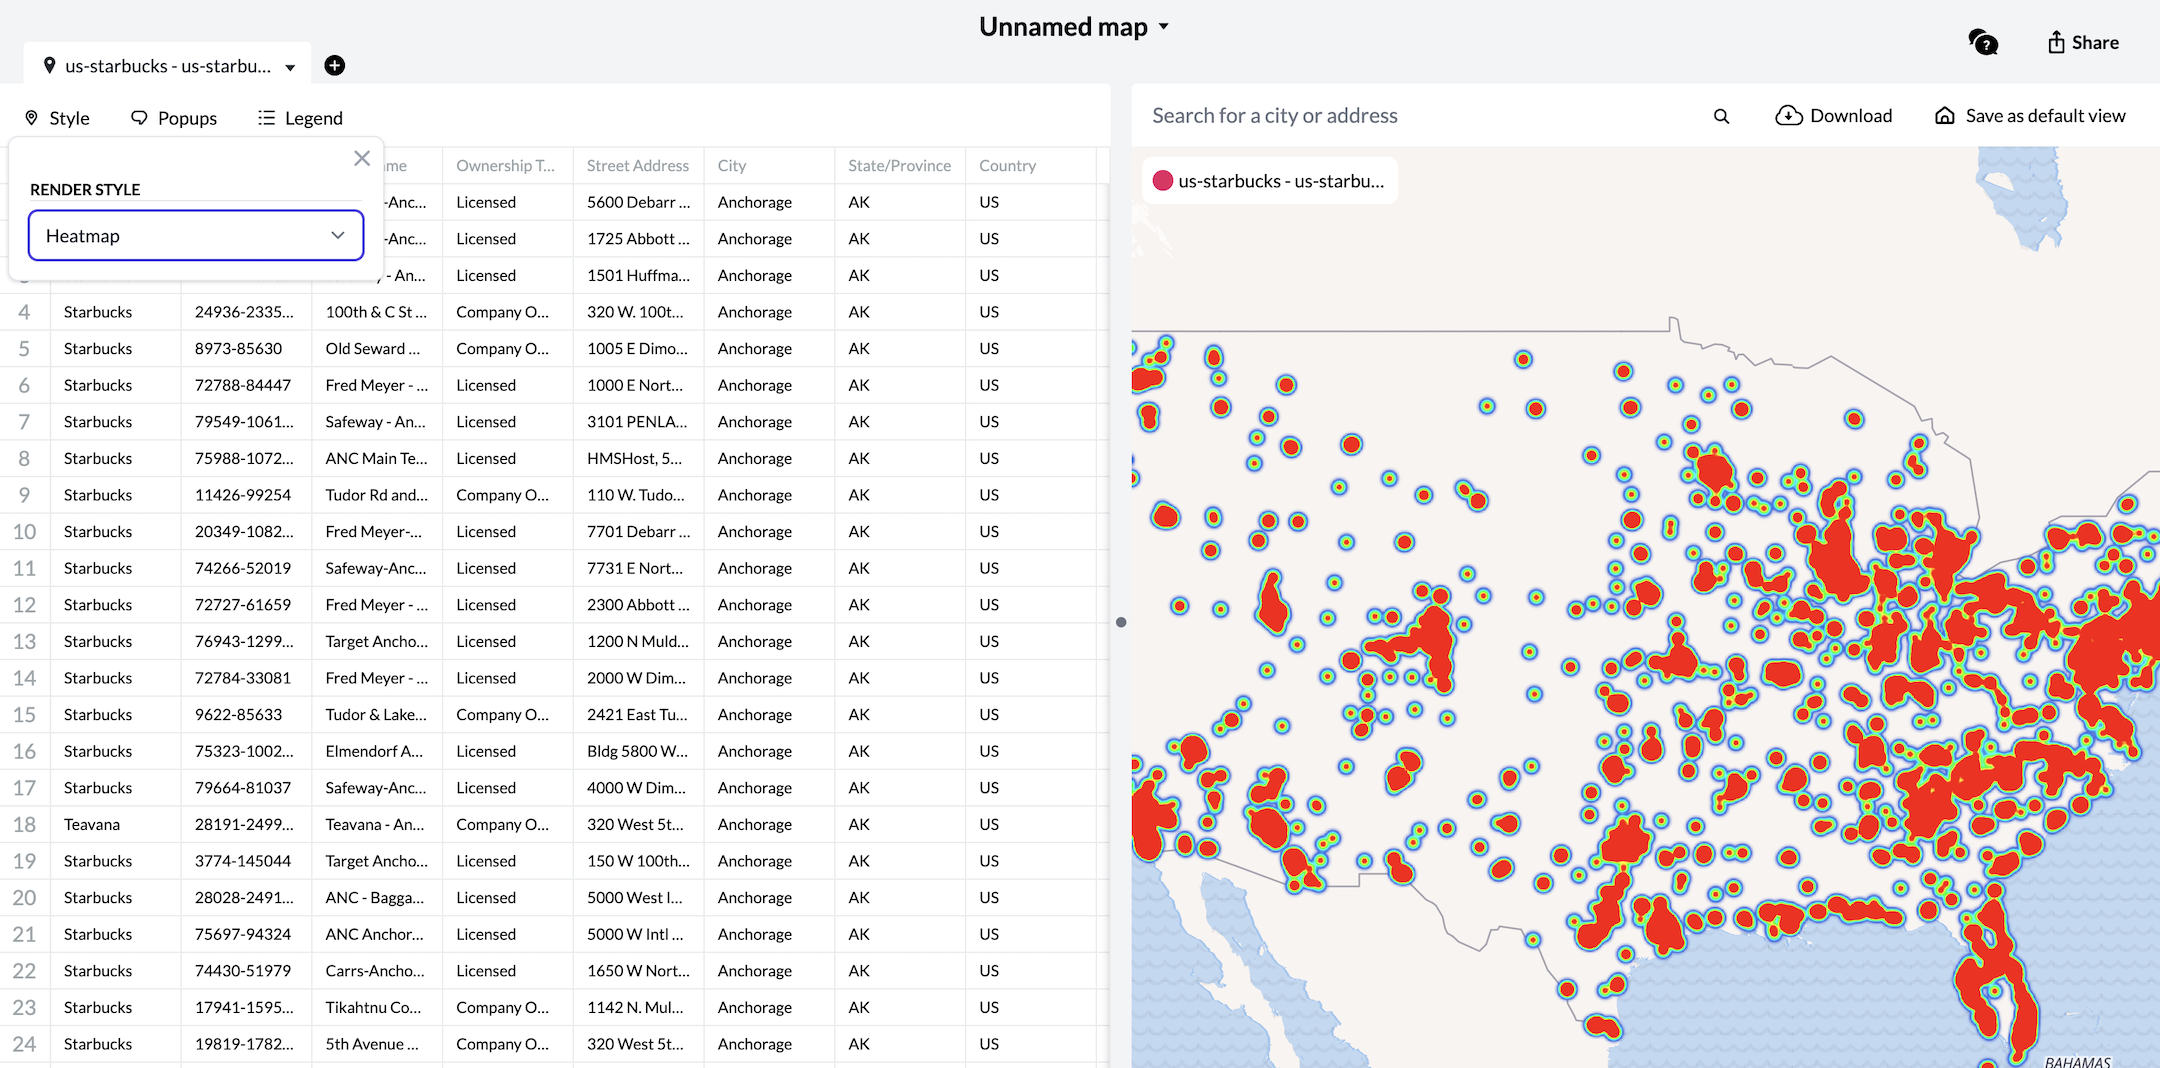
Heatmaps can be used to visualize the density of the coordinate pairs you've plotted to a map. You can replace the markers on your map with a heatmap overlay any time you'd like by changing the "Render Style".
Switching to a heatmap
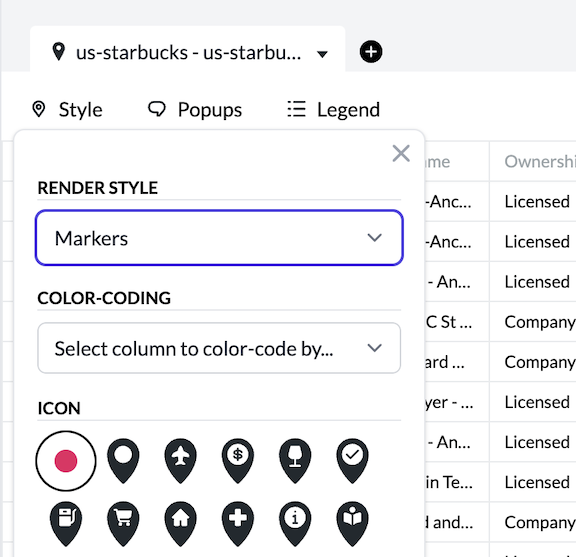
New maps automatically default to using markers. To switch to a heatmap, open the "Style" menu in the top left corner of your spreadsheet.
There, you'll find a dropdown menu called "Render Style", which will be set to "Markers". Click on it and select the "Heatmap" option.

The map will adjust immediately. A heatmap will render in place of your markers.

We also hide the marker styling options, since they will no longer be applicable. Keep in mind, any styling changes you made to your markers will be saved for use later. You won't lose any customization.
The heatmap adjusts as you Zoom-In, allowing you to identify individual coordinates.
You can switch back to marker mode at any time by changing your "Render Style" back to "Markers".