 January 16, 2025
Heatmapping Added to Maps
Heatmaps can now be added as an overlay on maps.
What's new?
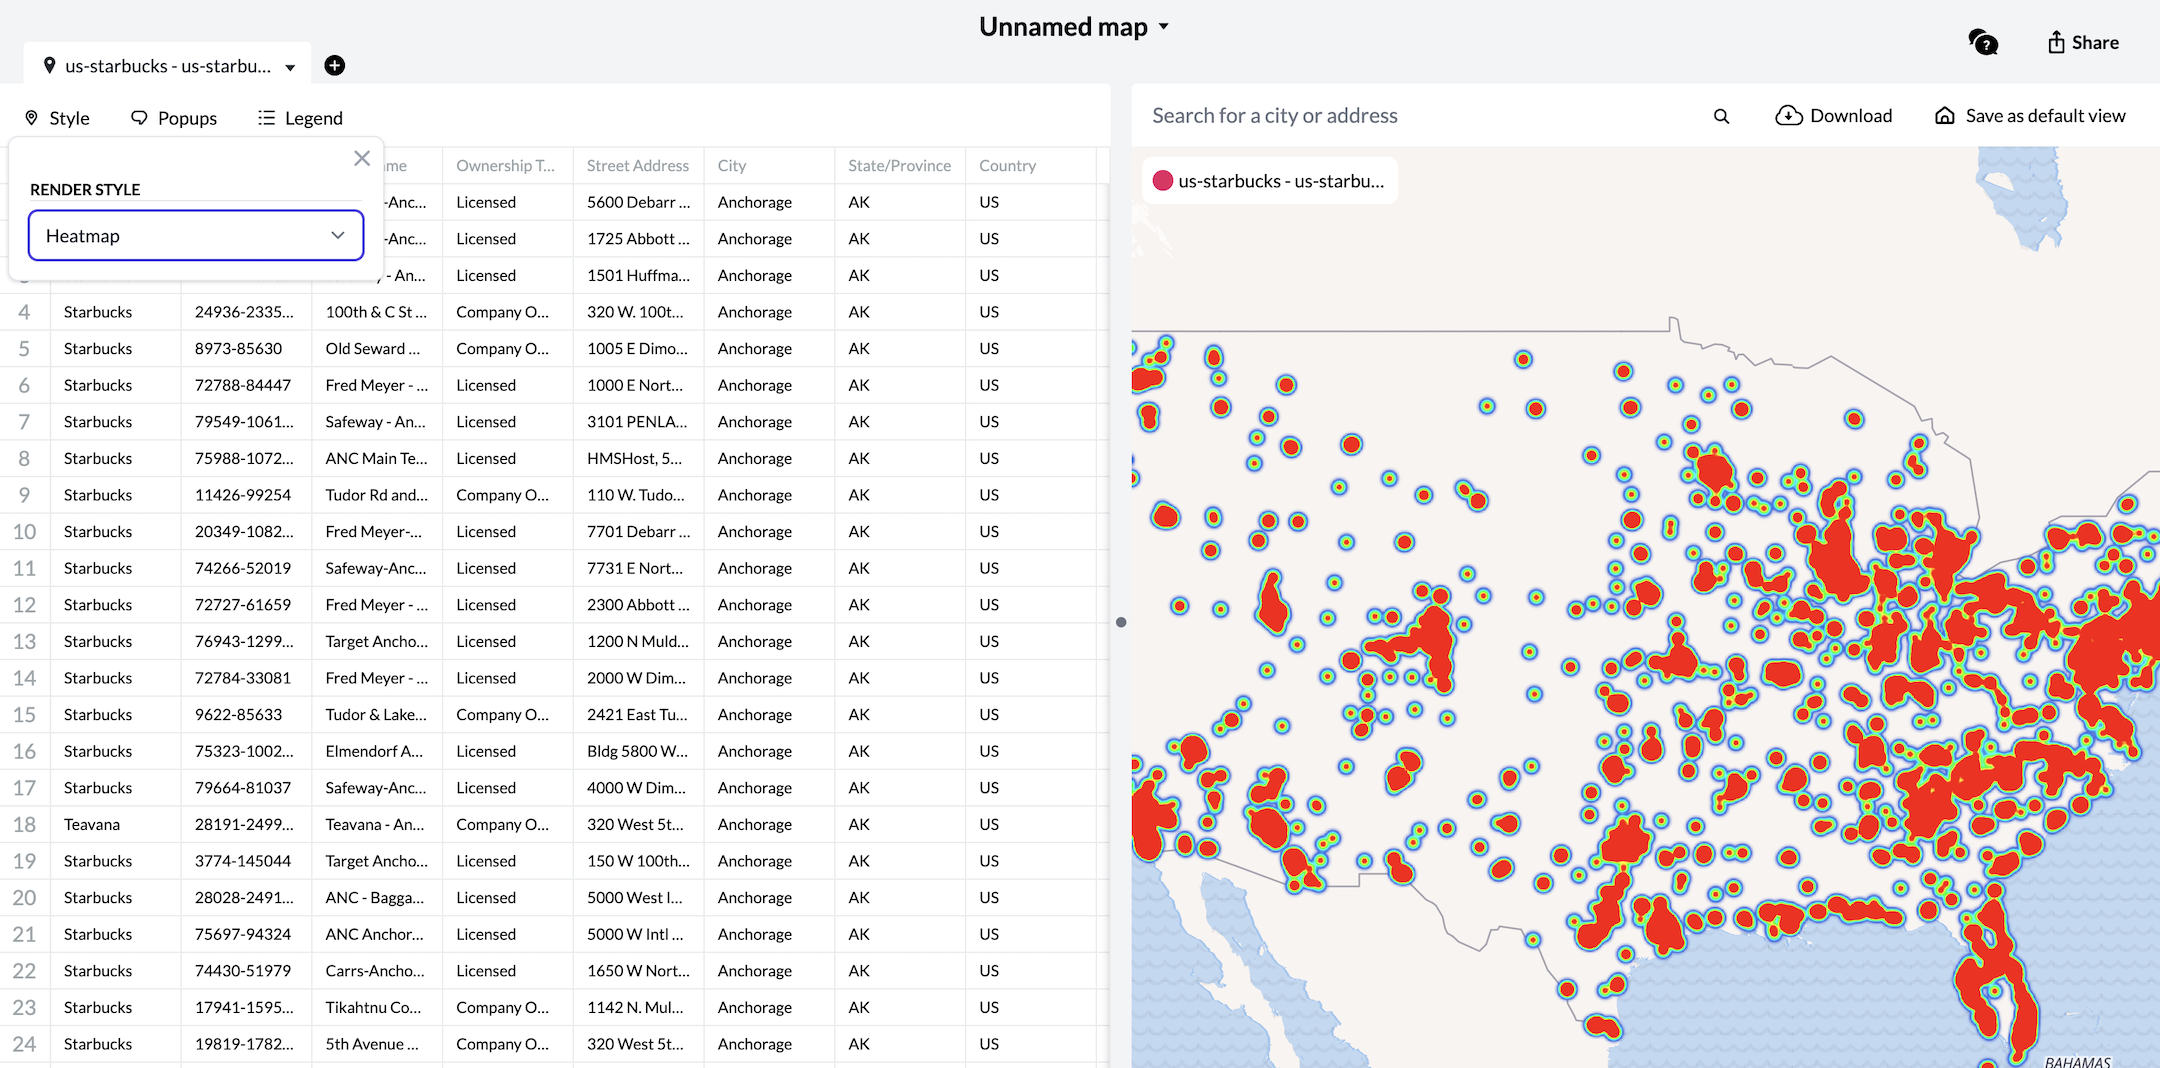
Customers who utilize our maps tool now have the ability to add a heatmap as an overlay. This replaces the existing markers, using the same data to visualize the density of the coordinates in your spreadsheet.
How do I switch to a heatmap?
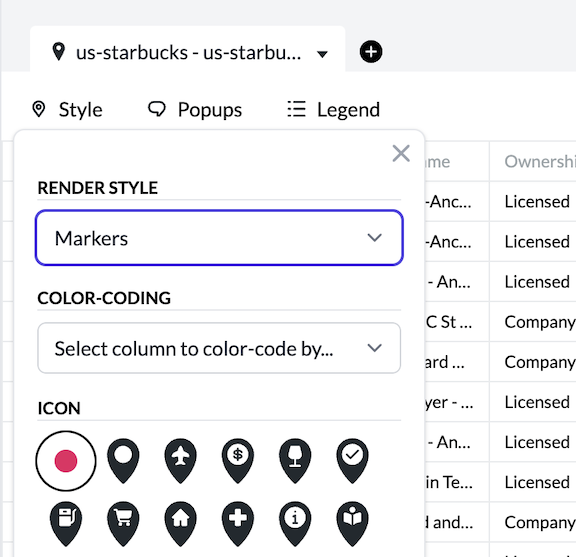
You can switch between marker mode and heatmap mode by navigating to the "Style" button in the top-left corner of your maps dashboard.
There, you'll find a new dropdown menu called "Render Style". This allow you select the style in which you'd like to render your data. We'll always defaut to "Markers" when you first create a map, but if you'd like to use a heatmap instead, click the button and select "Heatmap".

The map should adjust quickly. A heatmap will render in place of your markers.

You'll also notice the "Style" menu change. We remove all the marker customization options when you implement a heatmap since they will no longer have any impact. That said, we do save any marker customization you've set, so if you decide to go back to your original render style, the markers will keep their existing styles.
Your heatmap will change dynamically as you Zoom in-and-out. The closer you Zoom, the more you'll be able to identify individual coordinates.
If you decide you rather use the markers, you can always switch back using the "Render Style" dropdown.